
Trade and Industry at a Glance
This slideshow steps through five World Bank indicators on trade and industry, one frame per indicator. Each frame shows a ranking bar chart of countries, the value and rank for the United States, and a line of how that figure has moved over the available years. The numbers are the same ones used in the article below.
| Exports of goods and services | 177 | US exports equal 11.1075% of GDP in 2024, 177th of 192 economies |
| Imports of goods and services | 187 | US imports equal 14.2712% of GDP in 2024, 187th of 192 economies |
| Manufacturing value added | 94 | Manufacturing adds 10.7104% of US GDP, 94th of 203 economies |
| Foreign direct investment, net inflows | 1 | The US received about $297.1 billion of net FDI inflows in 2024, ranking 1st of 204 |
| High-technology exports | 25 | High-technology goods are 24.323% of US manufactured exports, 25th of 186 economies |
Read each frame on its own terms: the bar chart shows where countries fall on that one indicator, and the line shows direction of change over time. Do not compare values or ranks between frames — the units differ (shares of GDP, share of manufactured exports, US dollars) and the number of countries covered ranges from 186 to 204.
Key Points
Across the trade-and-industry indicators in this edition, the United States sits at opposite ends depending on what is being measured. On foreign direct investment, net inflows, the US ranks 1st of 204 economies at about $297.1 billion in 2024 — roughly 19.5% of the world total of about $1,522.8 billion. On trade openness the picture reverses: exports of goods and services equal 11.1075% of GDP, ranking 177th of 192, well under the world value of 29.1076%. Manufacturing value added is 10.7104% of GDP (94th of 203), below the world figure of 14.9944%, while high-technology exports are 24.323% of manufactured exports (25th of 186), just under the world value of 24.7589%. The pattern is a very large economy that attracts the most inbound investment in the dataset while trading a comparatively small share of its own output.
*Source: World Bank, World Development Indicators — Exports of goods and services (% of GDP), Manufacturing, value added (% of GDP), Foreign direct investment, net inflows (BoP, current US$), High-technology exports (% of manufactured exports).*
The Latest Value for the Lead Indicator
The lead indicator is exports of goods and services as a share of GDP. For 2024 the United States records 11.1075%, ranking 177th among 192 economies — that is the 16th position counting up from the bottom. The world value is 29.1076%, so the US figure is about 18.0 percentage points lower. The reading describes how large exports are relative to the size of the domestic economy, not how large exports are in absolute terms; a country with a very large GDP in the denominator will tend to show a low ratio even when its export volume is substantial.
*Source: World Bank, World Development Indicators — Exports of goods and services (% of GDP).*
Who Is at the Top and Who Is at the Bottom
At the top of the export-share ranking are Luxembourg at 191.533%, San Marino at 185.9928%, Hong Kong at 181.7913%, Singapore at 178.7763% and Ireland at 143.9846%, followed by Djibouti at 126.4153% and Malta at 118.4861%. Values above 100% appear where goods pass through an economy — entrepôt trade and re-exports — so these figures are not directly comparable with those of a large continental economy. At the bottom sit Sudan at 0.7209%, Haiti at 3.4008%, Ethiopia at 5.5393%, Kiribati at 5.9202% and Syria at 6.8101%, with Nepal at 7.6219% and Guam at 7.8871% just above. The United States at 11.1075% falls in the lower group, though it is above the single-digit readings at the very bottom. In imports of goods and services the US is 14.2712%, ranking 187th of 192, placed among Bangladesh at 16.3169%, Argentina at 12.68% and Ethiopia at 11.8612% — a neighbourhood defined by large domestic markets and by low-income economies alike, which is a caution against reading the ranking as a single quality scale.
*Source: World Bank, World Development Indicators — Exports of goods and services (% of GDP), Imports of goods and services (% of GDP).*
How It Has Changed Over the Past Decade
For exports, the US series runs from 13.5837% in 2013 to 11.1075% in 2024, a decline of about 2.5 percentage points, with the low point at 10.2141% in 2020 and a partial recovery to 11.7844% in 2022. Imports follow a similar shape: 16.4243% in 2013, a trough of 13.1875% in 2020, 15.5295% in 2022, and 14.2712% in 2024 — about 2.2 points below the 2013 reading. Manufacturing value added declines gradually across its available series, from 11.9061% in 2010 to 10.7104% in 2021, staying within a range of roughly 10.6% to 11.9%; note that this series ends in 2021 even though the indicator's latest year is listed as 2024. High-technology exports move the other way, from 20.1886% in 2013 down to 18.4843% in 2018 and then up to 24.323% in 2024, a rise of about 4.1 points over the twelve years. Foreign direct investment inflows swing widely year to year: about $288.1 billion in 2013, a peak near $511.4 billion in 2015, a low of about $137.1 billion in 2020, about $478.0 billion in 2021 and about $297.1 billion in 2024. These are nominal series, and the data alone does not identify what drove the movements.
*Source: World Bank, World Development Indicators — Exports of goods and services (% of GDP), Imports of goods and services (% of GDP), Manufacturing, value added (% of GDP), High-technology exports (% of manufactured exports), Foreign direct investment, net inflows (BoP, current US$).*
Comparing With Similar Countries
Against other large economies, the US export share of 11.1075% (177th) is the lowest of the comparison group: South Korea 44.3582% (68th), Germany 41.4341% (84th), France 33.8898% (103rd), the UK 30.9842% (115th), Japan 22.769% (141st) and China 20.0229% (151st). The US figure is about a quarter of South Korea's and just over half of China's. Imports show the same ordering, with the US at 14.2712% (187th) below China's 17.1755% (184th) and well below South Korea's 40.2843% and Germany's 37.6567%. In manufacturing value added the US records 10.7104% (94th), ahead of France at 9.5665% (109th) and the UK at 7.985% (130th) but behind South Korea at 26.618% (7th), China at 24.8692% (9th), Japan at 20.581% (17th) and Germany at 18.0067% (28th). High-technology exports place the US at 24.323% (25th), above China's 26.2777%? — no: below China at 26.2777% (22nd) and the UK at 29.2333% (19th) and South Korea at 36.2583% (14th), but above France at 23.1371% (28th), Germany at 17.9773% (41st) and Japan at 17.5547% (44th). On foreign direct investment the gap runs the other way: about $297.1 billion for the US, against about $52.1 billion for France, $47.6 billion for Germany, $18.6 billion for China, $16.2 billion for Japan, $12.9 billion for South Korea, and about -$13.0 billion for the UK, where a negative value means net outflows rather than an absence of investment.
*Source: World Bank, World Development Indicators — Exports of goods and services (% of GDP), Imports of goods and services (% of GDP), Manufacturing, value added (% of GDP), High-technology exports (% of manufactured exports), Foreign direct investment, net inflows (BoP, current US$).*
How to Read These Numbers
Four of the five indicators here are ratios, and each has a different denominator. Exports, imports and manufacturing value added are shares of GDP, so a large economy tends to show a smaller share regardless of the absolute amounts involved; high-technology exports are a share of manufactured exports, which measures composition rather than the technological level of an economy. Export and import shares can exceed 100% in economies where goods are re-exported, as with Luxembourg, Hong Kong and Singapore, so those readings sit on different structural ground. Foreign direct investment is a flow of net inflows in current US dollars rather than a stock, it can be negative — Switzerland at about -$108.4 billion, Liechtenstein at about -$87.2 billion, Hungary at about -$62.2 billion — and single-year changes are best not treated as a trend. Ranks are not comparable across indicators here, since the number of countries covered varies from 186 to 204. The manufacturing series also carries a mismatch worth noting: the latest year is given as 2024 while the available history stops at 2021. All figures come from the World Bank's World Development Indicators, which are updated annually and subject to revision, so readings may change in later releases.
*Source: World Bank, World Development Indicators — Exports of goods and services (% of GDP), Imports of goods and services (% of GDP), Manufacturing, value added (% of GDP), Foreign direct investment, net inflows (BoP, current US$), High-technology exports (% of manufactured exports).*
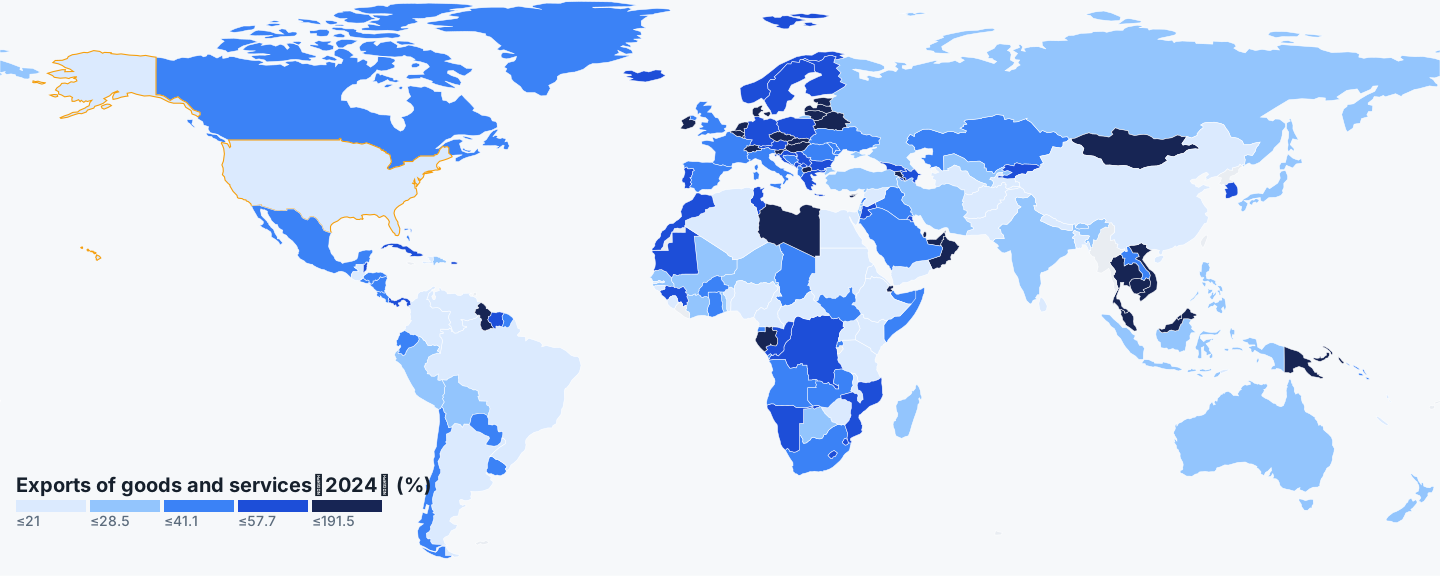
Exports of goods and services on the map and in charts
| Rank | Country / area | % |
|---|---|---|
| 1 | Luxembourg | 191.53 |
| 2 | San Marino | 185.99 |
| 3 | Hong Kong | 181.79 |
| 4 | Singapore | 178.78 |
| 5 | Ireland | 143.98 |
| 175 | New Caledonia | 11.69 |
| 176 | Malawi | 11.24 |
| 177 | US | 11.11 |
| 178 | Timor-Leste | 10.56 |
| 179 | Bangladesh | 10.46 |
| 190 | Ethiopia | 5.54 |
| 191 | Haiti | 3.4 |
| 192 | Sudan | 0.72 |
The table runs from Luxembourg at 191.533% and Hong Kong at 181.7913% down to Sudan at 0.7209% and Haiti at 3.4008%. The United States sits in the lower part at 11.1075%, above the single-digit readings but well below the middle.
The bars are very unevenly spread: the top values exceed 100% because of re-exports, while most countries cluster far below. The US line falls from 13.5837% in 2013 to a low of 10.2141% in 2020, then moves sideways to 11.1075%.
Compare countries
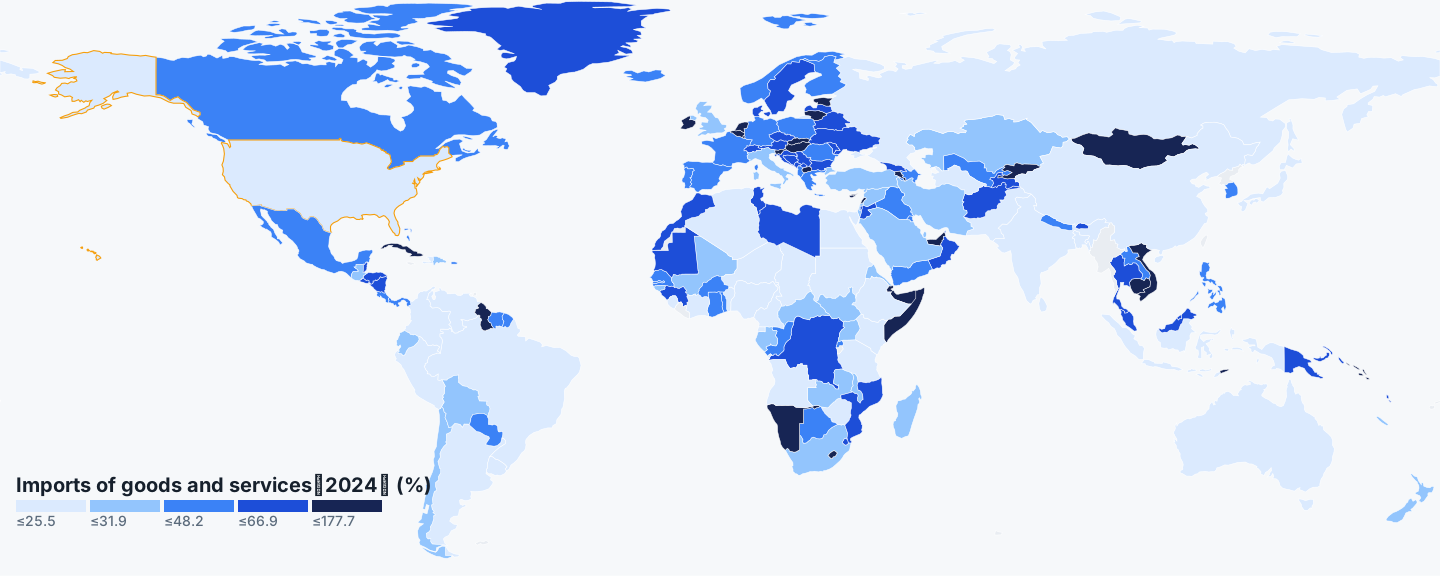
Imports of goods and services
| Rank | Country / area | % |
|---|---|---|
| 1 | Hong Kong | 177.72 |
| 2 | Luxembourg | 159.74 |
| 3 | San Marino | 154.99 |
| 4 | Singapore | 143.6 |
| 5 | Djibouti | 114.82 |
| 185 | Nigeria | 16.93 |
| 186 | Bangladesh | 16.32 |
| 187 | US | 14.27 |
| 188 | Argentina | 12.68 |
| 189 | Ethiopia | 11.86 |
| 190 | Turkmenistan | 11.16 |
| 191 | Venezuela | 9.22 |
| 192 | Sudan | 1.27 |
Hong Kong leads at 177.7154%, with Luxembourg at 159.735% and Singapore at 143.5951% close behind; Sudan is last at 1.2745%. The United States appears near the bottom at 14.2712%, next to Bangladesh at 16.3169% and Argentina at 12.68%.
The chart shows the same long tail as exports, with a handful of trade hubs far out ahead. The US line dips to 13.1875% in 2020, recovers to 15.5295% in 2022, and settles at 14.2712%.
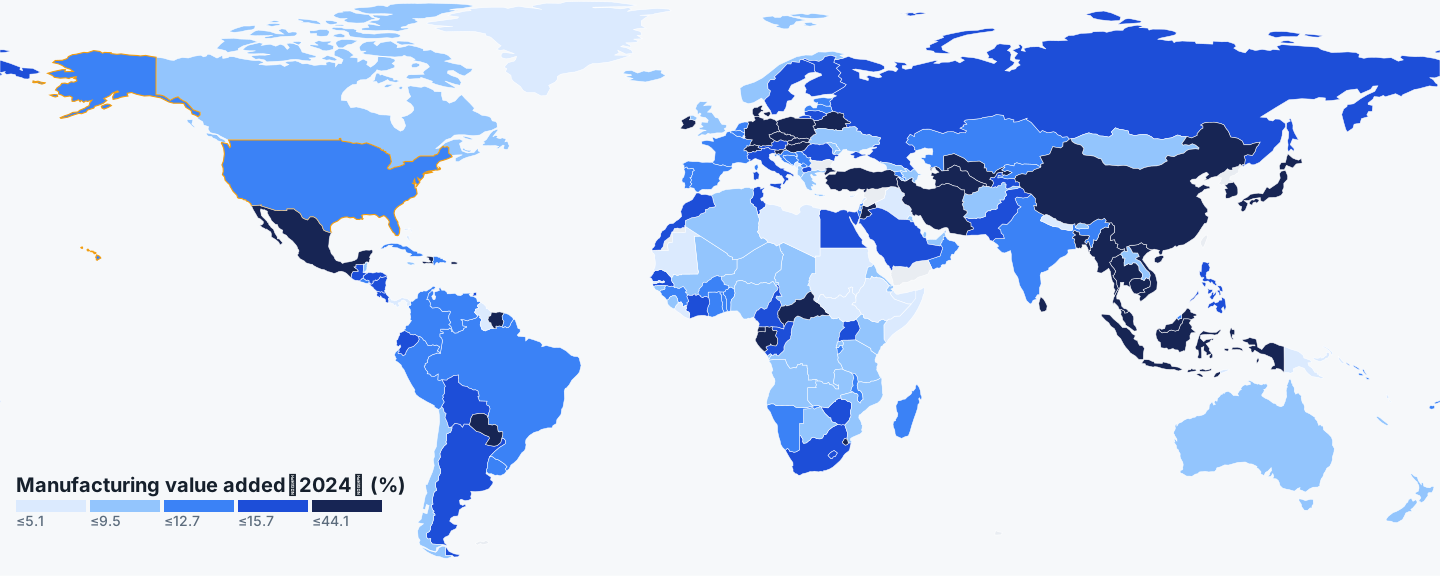
Manufacturing value added
| Rank | Country / area | % |
|---|---|---|
| 1 | Puerto Rico | 44.14 |
| 2 | Liechtenstein | 34.17 |
| 3 | San Marino | 31.77 |
| 4 | Ireland | 29.57 |
| 5 | Eswatini | 29.12 |
| 92 | Spain | 10.84 |
| 93 | Estonia | 10.83 |
| 94 | US | 10.71 |
| 95 | Cuba | 10.68 |
| 96 | Brunei | 10.66 |
| 201 | Micronesia | 0.51 |
| 202 | Turks & Caicos Islands | 0.45 |
| 203 | Bermuda | 0.33 |
Puerto Rico tops the table at 44.1443%, ahead of Liechtenstein at 34.1726% and South Korea at 26.618%; Bermuda is last at 0.3311%. The United States is mid-table at 10.7104%, behind Germany at 18.0067% and Japan at 20.581%.
The bars thin out sharply below the top ten, with most economies under 20%. The US line drifts down from 11.9061% in 2010 to 10.7104% in 2021, the last year with data in this series.
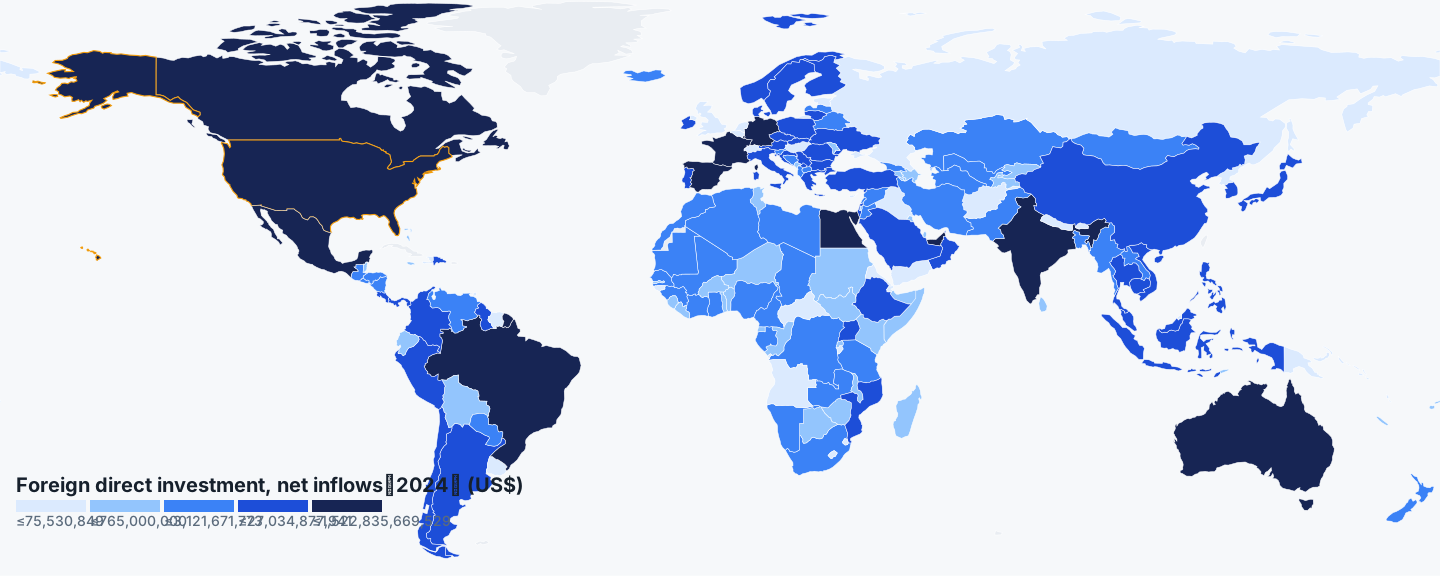
Foreign direct investment, net inflows
| Rank | Country / area | US$ |
|---|---|---|
| 1 | US | 297,058,000,000 |
| 2 | Singapore | 135,077,157,183 |
| 3 | Hong Kong | 125,820,976,920 |
| 4 | Luxembourg | 105,986,643,430 |
| 5 | Brazil | 74,090,786,050 |
| 202 | Hungary | -62,190,710,104 |
| 203 | Liechtenstein | -87,212,093,508 |
| 204 | Switzerland | -108,395,568,634 |
The United States leads the table, ahead of Singapore at about $135.1 billion and Hong Kong at about $125.8 billion. The bottom entries are negative — Switzerland at about -$108.4 billion and Liechtenstein at about -$87.2 billion — meaning net outflows.
The gap between first place and the rest is the widest in this slideshow, more than double the second-ranked figure. The US line swings hard: about $511.4 billion in 2015, about $137.1 billion in 2020, about $478.0 billion in 2021, then about $297.1 billion.
High-technology exports
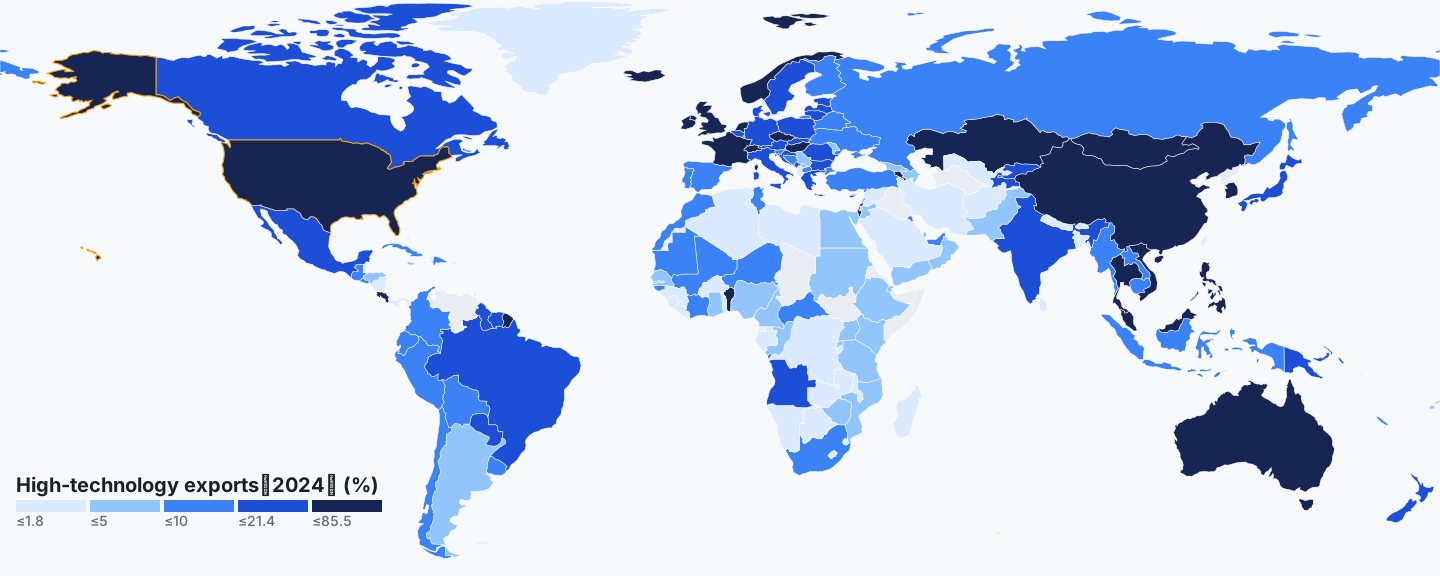
| Rank | Country / area | % |
|---|---|---|
| 1 | Cayman Islands | 85.52 |
| 2 | Samoa | 76.67 |
| 3 | Hong Kong | 75.57 |
| 4 | Philippines | 60.98 |
| 5 | Singapore | 59.43 |
| 23 | Norway | 25.41 |
| 24 | Australia | 25.16 |
| 25 | US | 24.32 |
| 26 | Armenia | 23.64 |
| 27 | Netherlands | 23.47 |
| 184 | Antigua & Barbuda | 0 |
| 185 | Bahamas | 0 |
| 186 | Macao | 0 |
The Cayman Islands lead at 85.5232%, with Hong Kong at 75.5707% and the Philippines at 60.9753% near the top, while several economies register 0.0%. The United States at 24.323% sits in the upper quarter, above Germany at 17.9773% and Japan at 17.5547%.
Values fall away steeply from the top and then flatten across most of the field. The US line dips to 18.4843% in 2018 before rising to 24.323% in 2024, the highest reading in its twelve-year series.